
Lab Report Template
Labquest Instructions
Walking Speed Lab
Each student should have a unique solution set.
You must use conversion factors and show your work to receive credit.
Round to the fourth decimal place.
You must use conversion factors and show your work to receive credit.
Round to the fourth decimal place.
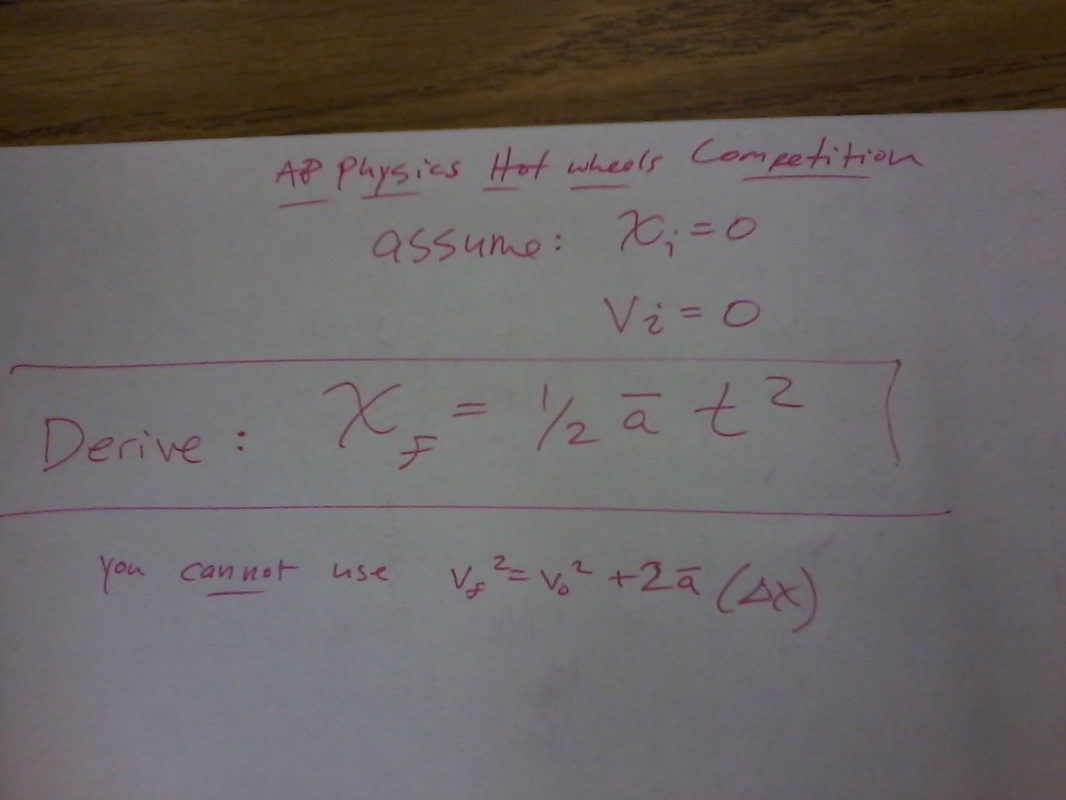
Hot Wheels and Human MPH Activity
*You must show your work to receive full credit.
Hot Wheels Unit Conversion and Collision Lab
Hot Wheels Kinematics Labs
Helicopter Lab
*Teacher will introduce force vectors and the concept of terminal velocity.
Objective: Student will be able to distinguish position-time graphs from distance-time graphs. Students will be able to create position-time graphs and equations of motion for objects with a constant velocity.
Materials:
Helicopter (paper and paper clip), meter stick, stop watch
Instructions:
After collecting your data (height in meters and time in seconds), create three position-time graphs for your helicopter being dropped from the top of the stairs. Each graph will have a different origin, specifically the top, middle, and ground levels of the stairs. A minimum of 5 different heights (3 at the top, middle and ground stair levels) with three trials per height is required. You may average the three trials so as to have one time per height for a total of 5 data points. From your position-time graphs create three different equations of motion, one for each of the position-time graphs (e.g. Xf=Vt+Xi). Make certain the intervals on the X and Y axis are equivalent for all graphs. Turn in a pdf of your work to CANVAS.
Which is a better glider with non-functioning engines, an airplane or helicopter?
Proportionality Lab - Hewitt
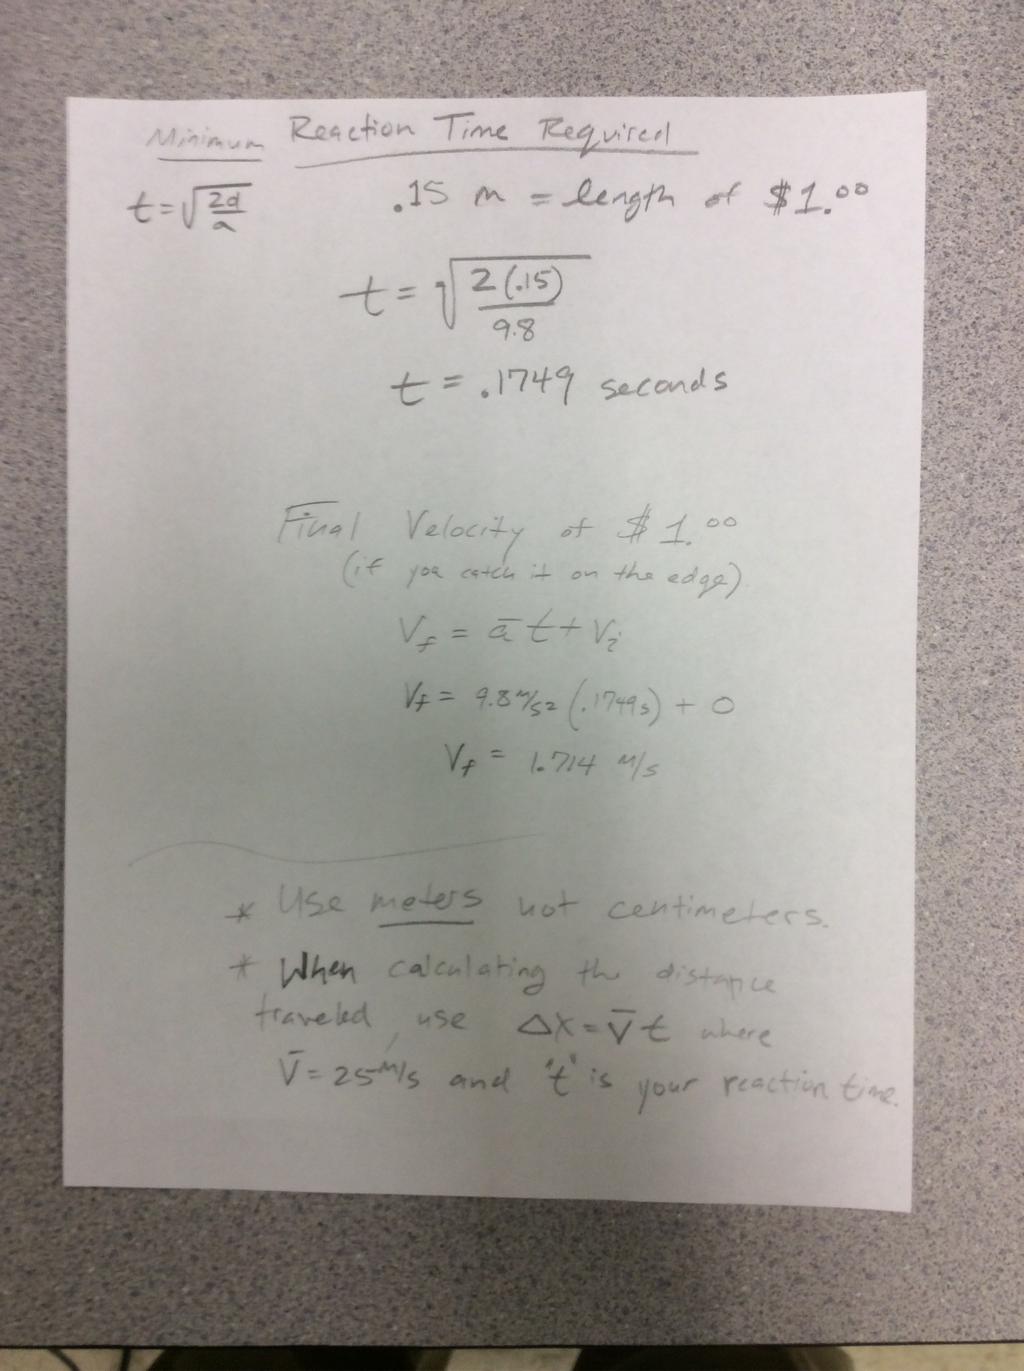
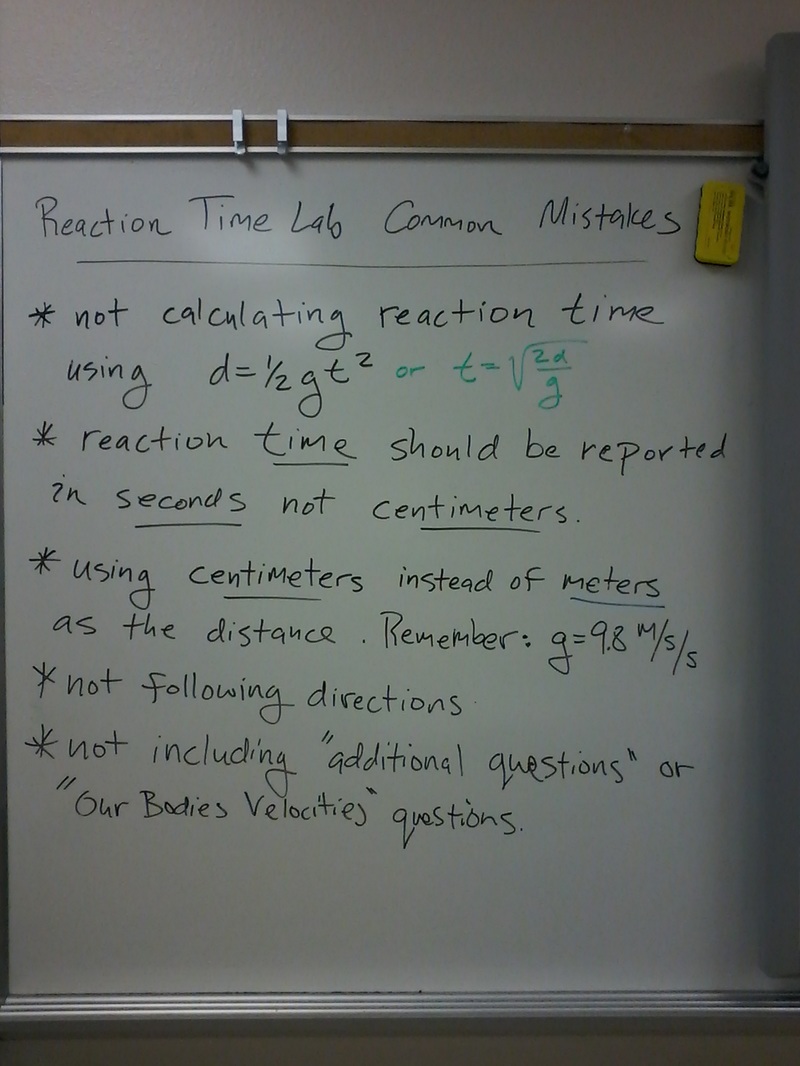
Reaction Time Lab
*To receive full credit you must show and submit your work on the lab worksheet to CANVAS.
*You do NOT need a stop watch to measure your reaction time.
*You do NOT need a stop watch to measure your reaction time.
| reaction_time_lab_ws.pdf |
The average reaction time for humans is 0.25 seconds to a visual stimulus, 0.17 for an audio stimulus, and 0.15 seconds for a touch stimulus.
Would you be able to catch the dollar bill?
Written Lab Report Version of Reaction Time Lab
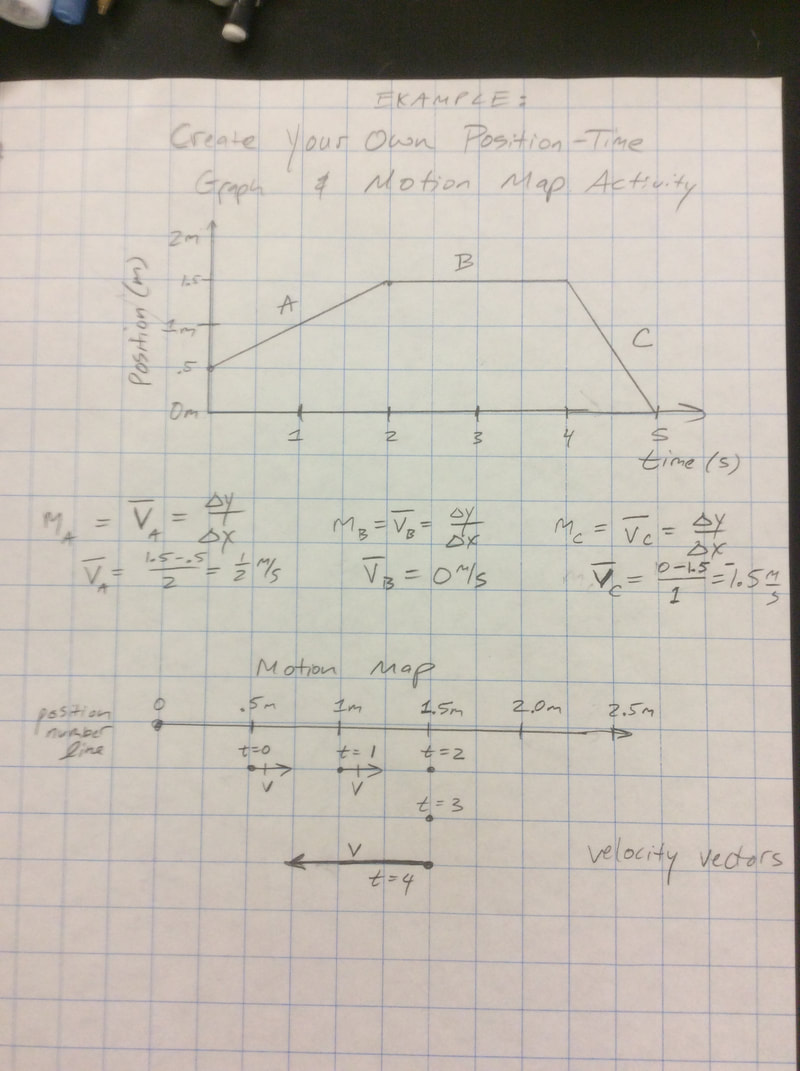
Create Your Own Position-Time Graph and Motion Map
(aka Motion Detector Lab 1)
*Motion maps display velocity vectors, not displacement vectors. A displacement vector spans and connects the length from beginning position to ending position without regard to time. A velocity vector begins at the position of an object for a specified time; its length will vary according to the velocity magnitude for that specific time. Both velocity and displacement vectors have direction indicated by the tip of the arrow.
Instructions:
1.Using the motion detector create a position-time graph of your individual movement. Your graph should contain three consistent slope segments (e.g. moving toward the wall at a constant speed, moving away from the wall at a constant speed, and staying in place). You may use the 'curve fit' function to find slopes of the three segments or you may take a photo of the lab quest screen so that others in your group have time to also use the device.
2. On graph paper, or your ipad, sketch your position-time graph and write the velocities next to each segment.
3. Below your position-time graph, create a motion map of your movement with a velocity vector for each second.
4. Turn in a single pdf of your work (position-time graph, velocities, and motion map) to CANVAS.
5. If you finish early, take turns playing the 'motion match game' on the lab quest.
6. Leave the lab quest plugged in to the electrical outlet when you are finished.
Tips:
Make certain the metal screen sensor is always flat to the wall.
Maintain a minimum distance of .5 meters from the wall.
Make certain all cords are fully plugged into the devices.
You need 3 distinct segments; it does not matter if the device runs for 5, 10 or 30 seconds.
The battery of some lab quests do not last long. Keep the device plugged into the wall.
You can bounce sound off the ground if there is no flat wall space.
Prior Year Instructions
Motion Detector Lab 2
*the motion detector is not necessary for this lab, but may be used as an aide
*if the initial position is not given, you may choose it; the overall graph shape will be the same
*if the initial position is not given, you may choose it; the overall graph shape will be the same
Problems Assigned to Groups
Group 1: #7 & #8
Group 2: #6 & #9
Group 3: #5 & #10
Group 4: #4 & #11
Group 5: #3 & #12
Group 6: #2 & #13
Your group should have two white boards. Use one whiteboard per problem. Include the motion map, position-time graph, velocity-time graph and the written description on the white board. After your group has completed the assigned problems, use the motion detector to verify your position-time and velocity graphs.
*The people with the most pets and the least number of pets will present the two problem to the class.
Motion Detector Lab 3 (Cart on an Incline)
*Do NOT sketch the entire graph shown on the lab quest screen. Only sketch the portion relevant to the motion of the cart.
*Be mindful of where the origin is located and the directions (+ or -) indicated on the ramp drawing. #1 and #3 are not the same!
*Remember to sketch your prediction graphs before using the motion detector.
*You can walk to the other side of the table to make left-right motion into right-left motion or vice versa.
*Always leave the pasco cart wheels up! Do not let them roll onto the floor. There is a $50 cart replacement fee.
*Do not use the spring release on the cart during this lab.
*The lab quest will not produce an acceleration-time graphs, only x-t and v-t graphs to check your predictions.
*The shallower the angle of incline, the better the data on your lab question device.
lab follow up worksheets
Motion Detector Lab 4
Fan Cart Motion Detector Lab
*This lab must be completed as a class because there are only 2 fan carts.
Ball Toss Lab
| ball_toss_lab_ws.pdf |
Moving Man Lab
Part 1 introduces position-time graphs.
Part 2 introduces velocity-time and acceleration-time graphs.
Part 2 introduces velocity-time and acceleration-time graphs.
*You may use the 'Charts' tab as a short cut to create your stacked kinematic graphs.
*You will be graded primarily on the overall shape of your graphs.
*You will be graded primarily on the overall shape of your graphs.
Cars Overtaking and Colliding Activity
*Do NOT determine position through trail and error. You must use the physics concepts that we discussed in class.
*Do NOT force the cars to roll. They break easily when forced or dropped.
*Choose two cars with a large difference in their speeds.
*If you test your prediction without Mr. Barker present, your group may receive a zero for the activity.
*You will have two attempts to predict the collision and overtaking positions.
*For part 2, assume the starting positions are +1 m for the fast car and +1.5 m for the slow car.
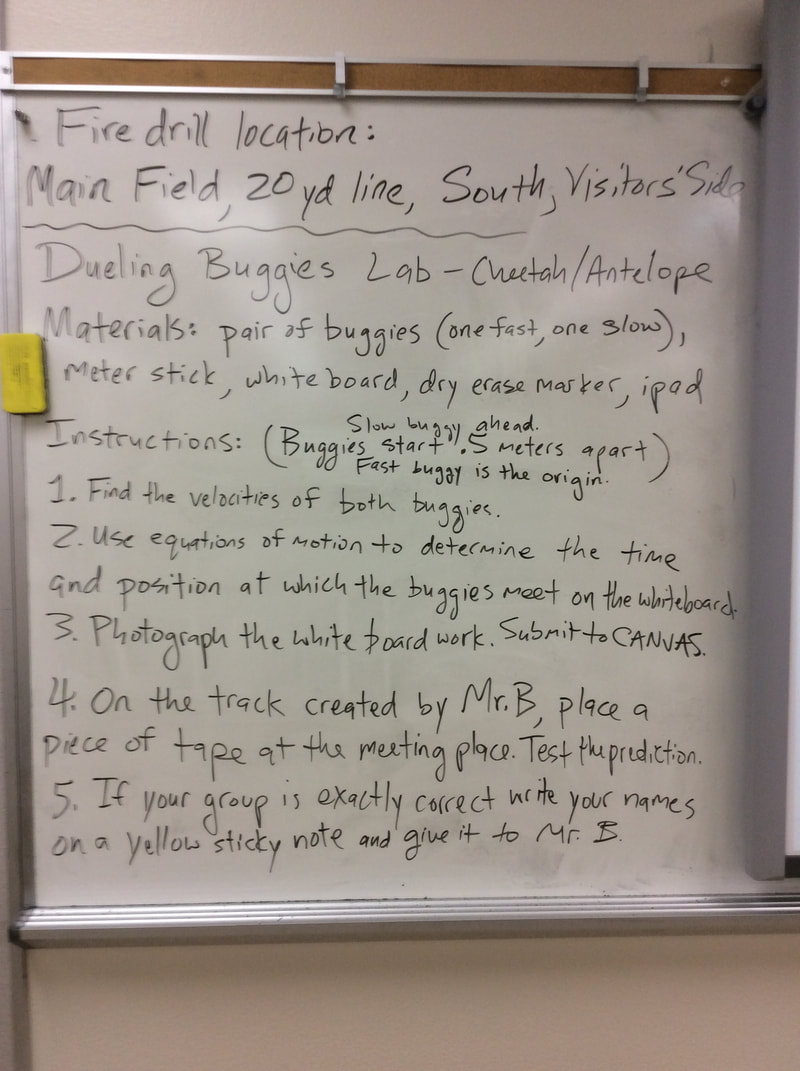
Dueling Buggies Labs
1. Off-set starting position (Catch Up or Cheetah/Antelope)
Buggies must meet when the front of the buggies are aligned.
Do NOT run the buggies at the same time! Find their velocities individually.
Do NOT run the buggies at the same time! Find their velocities individually.
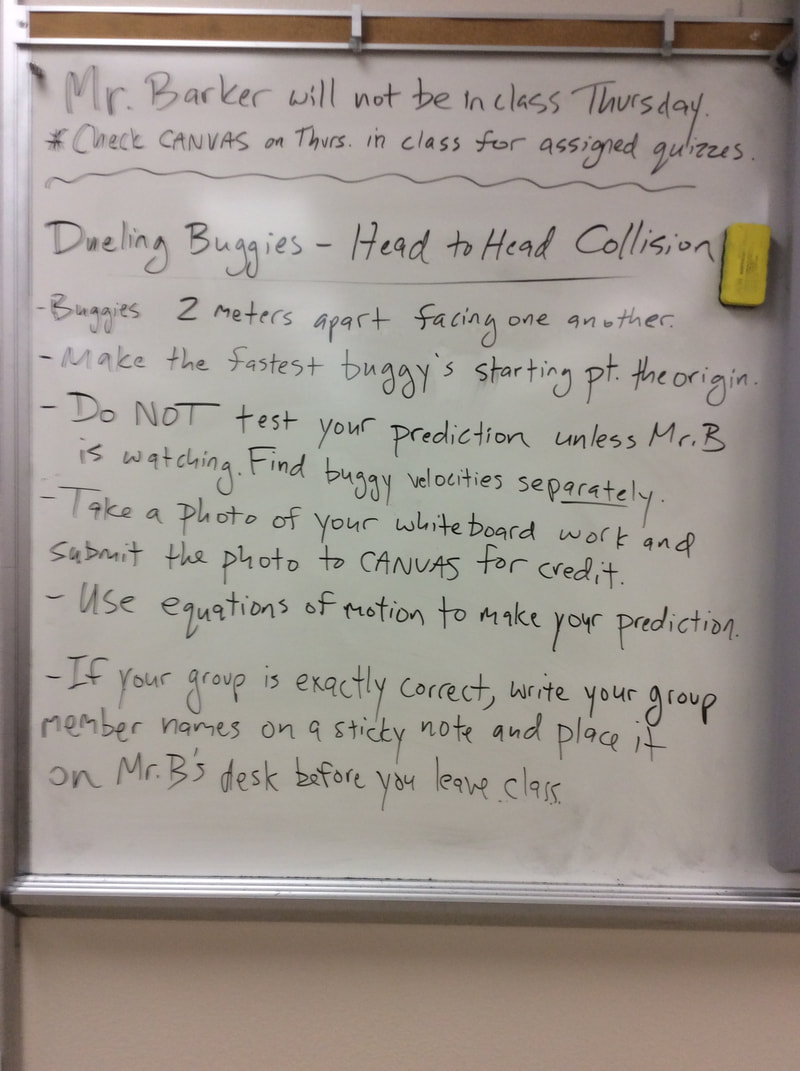
2. Head to Head Collision
Caterpillar Speed
Party Popper Demonstration
Instructions:
1. Create qualitative stacked kinematic graphs (Position-time, Velocity-time and Acceleration-time)of the motion of the popper from the ground and back to the ground. Assume the ground is position 0 meters, up is positive, and down is negative.
2. Create a qualitative motion map of the poppers motion. Include acceleration and velocity vectors on your map.
Wheel and Axle on an Incline
*The formatting of the lab analysis guide may make it difficult to paste photos or screenshots. I recommend opening a completely new word document to create your analysis/report.
*You may create separate velocity-time curve graphs or you may draw qualitative graphs on the same axis.
*You may create separate velocity-time curve graphs or you may draw qualitative graphs on the same axis.
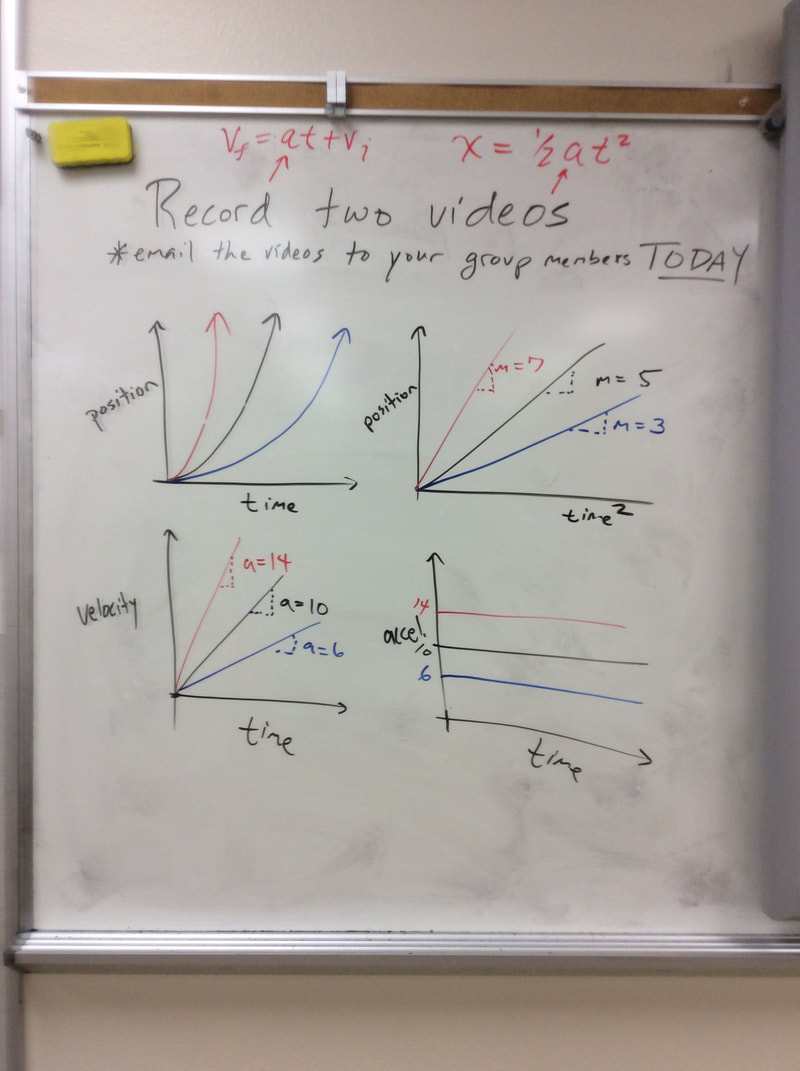
Video Recording Instructions:
1. Include the meterstick length in your video with the meter side up (not the inches side).
2. The maximum height of your incline should only be a few inches (e.g. 3-5 inches), not more than 10 inches for the steepest incline.
3. Email everyone in your group the two videos before you leave class TODAY! It takes time for the video files to arrive by email.
4. Keep the ipad steady and directly above the incline when recording the video.
5. Do not allow the axles to 'slip' as it rolls down the incline--if it does, the slope is likely too steep!
6. Be certain that the object moves from left to right length wise across the video screen.
7. During recording your ipad angle should match the angle of the ramp.
8. Do NOT move the ipad while you are recording!
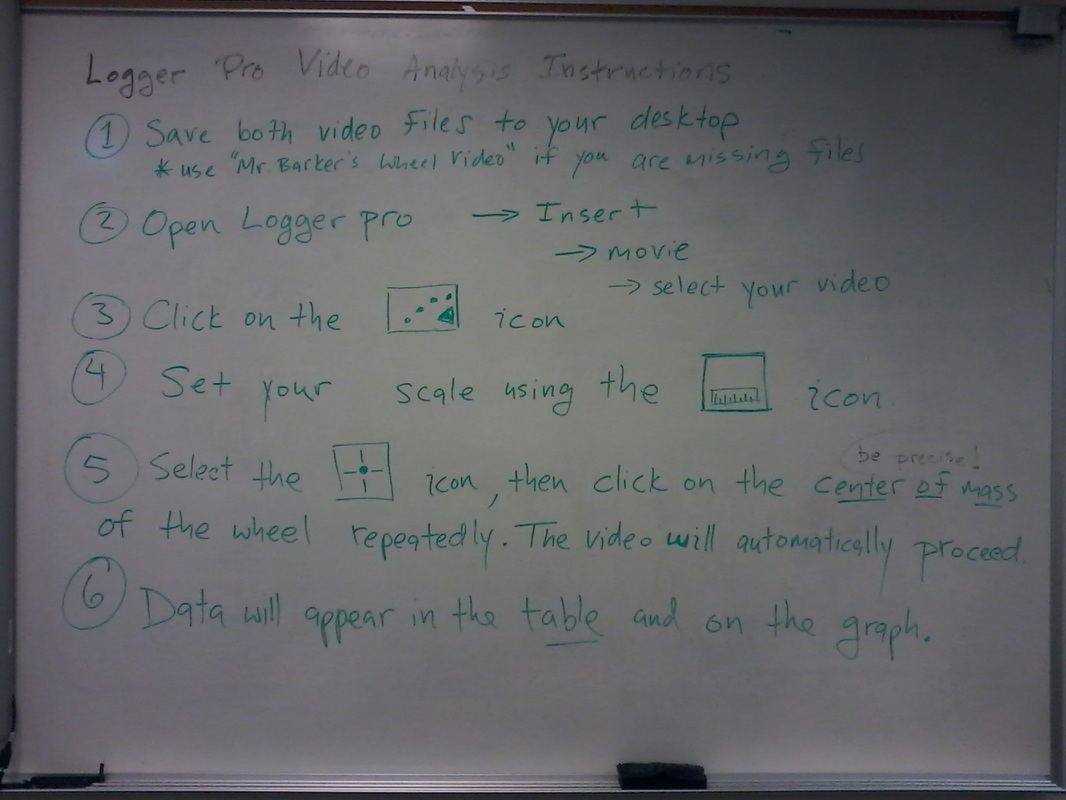
Instructions for collecting data from a video:
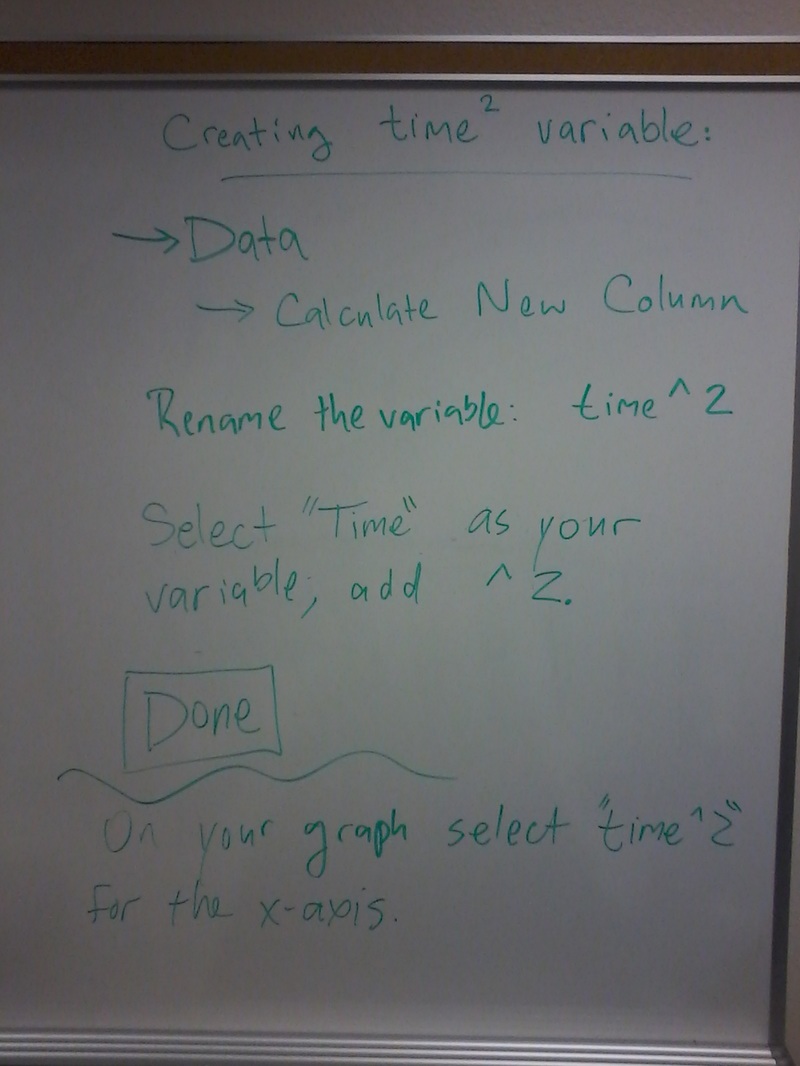
Instructions for creating time^2:
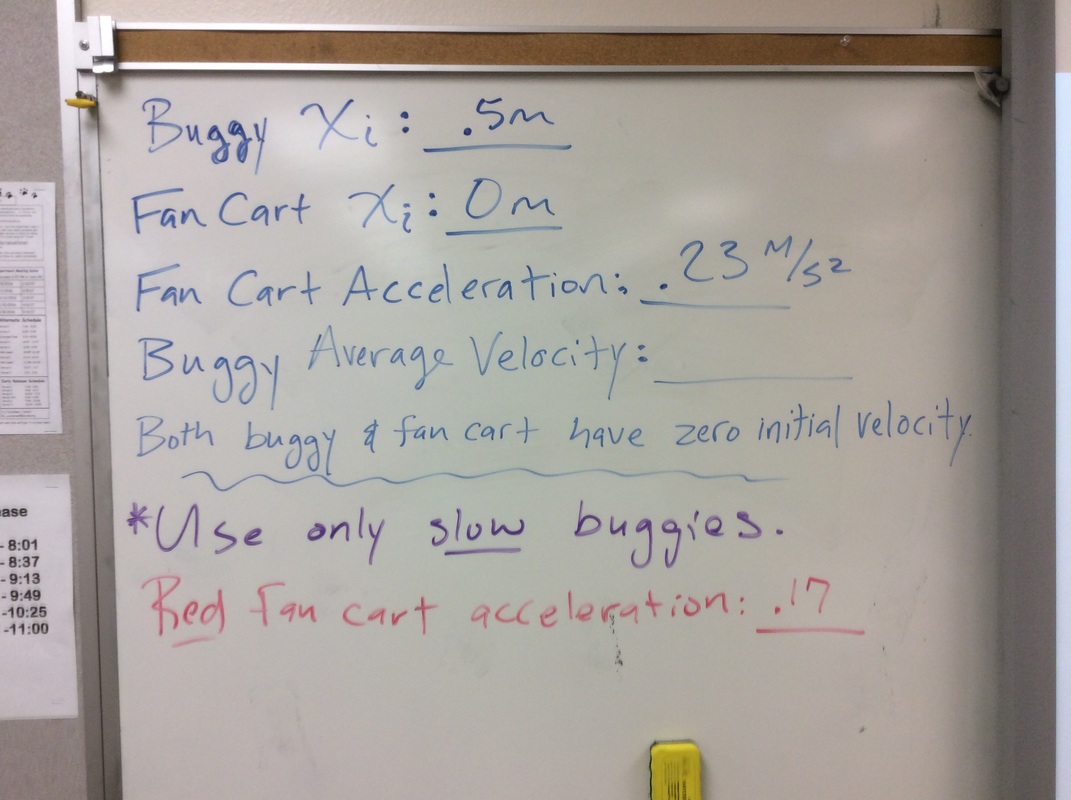
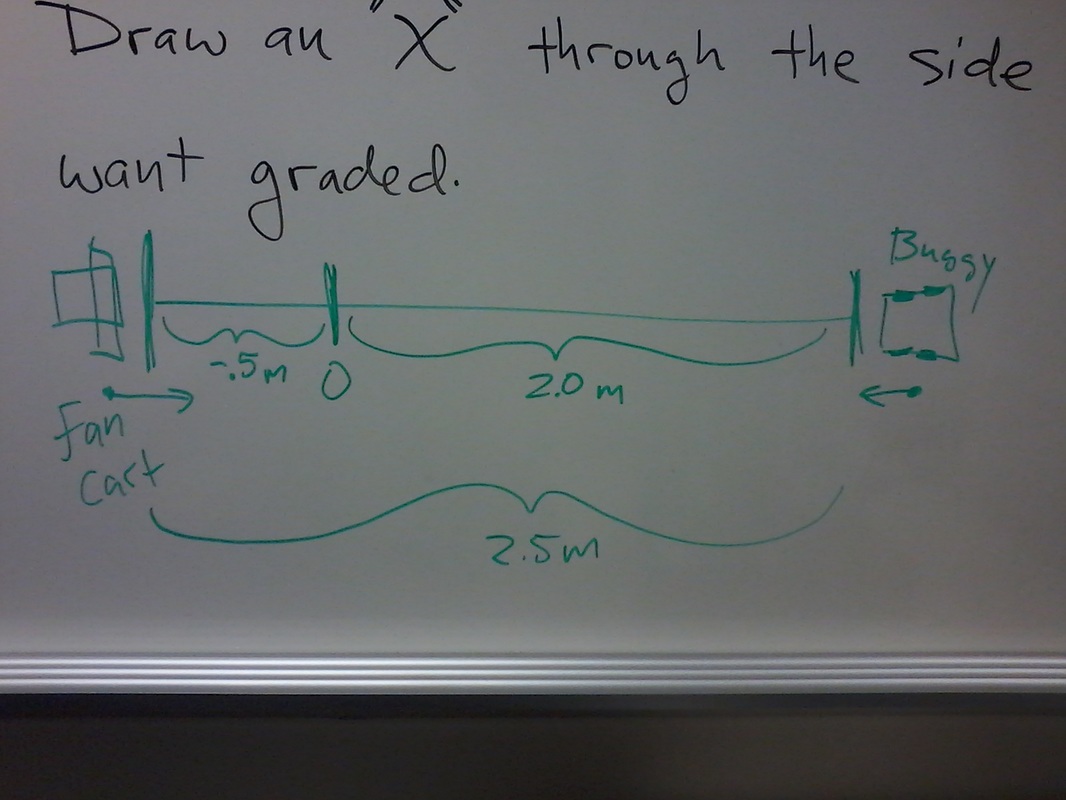
Fan Cart and Buggy Collision Activity
(stop watch version)
The above worksheet is meant as a guide. You will perform your work on the white board and submit a photo of the white board to canvas in order to receive credit. Your group's prediction must be within .10 meters (10 cm) to the actual collision position in order to receive full credit. Mr. Barker must be present when you test your prediction in order for your group to receive credit.
The Buggy and Fan Cart will travel toward one another.
Group 1: Fan Cart begins at position 6.0 meters and buggy begins at 2.5 meters
Group 2: Fan Cart begins at position 1.5 meters and buggy begins at 4.5 meters
Group 3: Fan Cart begins at position 5.0 meters and buggy begins at 2.5 meters
Group 4: Fan Cart begins at position 0.5 meters and buggy begins at 3.5 meters
Group 5: Fan Cart begins at position 1.0 meters and buggy begins at 4.0 meters
Group 6: Fan Cart begins at position 0.5 meters and buggy begins at 4.5 meters
Fan Cart and Buggy Collision Activity
(logger pro version)
High Dive into 1 foot of Water (G Forces)
Packet A2 Page 21 or A1 Page 17
Ramp and Roll Simulation
GALILEO'S KINEMATICS Lab
*We will use nerf balls in place of empty cans.
*Only complete part A of the Galileo Lab
Galileo Lab Report Instructions
Unit 3 WS 1 is an excellent resource for this lab and for the district assessment.
Complete Part A only.
Your report must be typed and must follow the lab report template outline. You may draw your graphs and tables on paper and insert them as images into your typed lab report. You may have up to three people in your group turning in one single report. Include each individual's name on the report. You also have the option of working alone.
Include the following in your lab report:
- State the hypothesis.
- Describe how you plan to test the hypothesis.
- Describe your procedures.
- What is the dependent variable?
- What is the independent variable?
- What are the control variables?
- Record your data in a table, include distance, time, time^2, velocity and acceleration as columns.
- Graph distance v. time.
- Graph distance v. time squared.
- Graph velocity v. time (average velocity is equal to the instantaneous velocity of the midpoint time).
- Sketch the acceleration v. time graph.
- Create a best fit line to the distance v. time squared scatter plot graph. Find the slope of the line.
- Determine the acceleration of the ball from the slope of the best fit line of the distance-time^2 graph.
- Does your graph of distance v. time squared support the hypothesis? Why or why not?
- What are some potential sources of error in your data?
Galileo Lab Report Hints
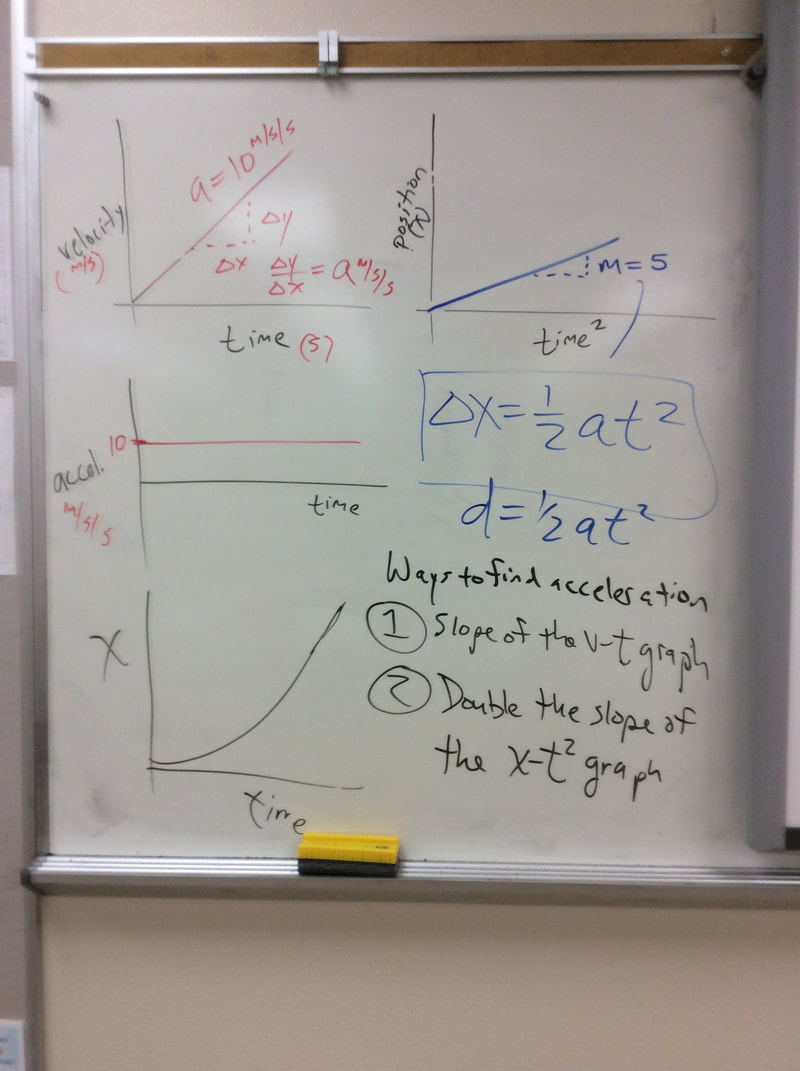
Purpose: To demonstrate that acceleration is constant on an inclined plane and demonstrate three ways that the constant acceleration can be determined:
1. Use the equation d=(1/2) a t^2 (which assumes initial velocity is zero) and solve for 'a' then a = 2d/(t^2).
2. Double the slope of the distance - time^2 graph.
3. The slope of the velocity -time graph.
Hypothesis: Acceleration is constant for an object rolling down an inclined plane of fixed height.
Hypothesis Test: If acceleration is constant for an object, then the distance traveled by the object down an inclined plane is directly proportional to time it spent traveling down the inclined plane SQUARED. (Proportional means a straight line relationship) . If the scatter-plot of distance and time^2 produces a straight best fit line that passes through the origin, then the hypothesis is supported.
Control Variables: constant angle of steepness, zero initial velocity of the object, constant force gravity
Independent variable: Distance
Dependent variable: Time (or Time Squared)
Investigation 3B: Velocity, position, and time
Pg. 84 in the e-book. See canvas announcements for the book code.
To complete this assignment for full points you must submit 3 ipad screen shots, one from each part.
Part 1: Matching the motion of an ErgoBot
Take a screen shot of your best velocity match attempt and submit to canvas
Take a screen shot of your best velocity match attempt and submit to canvas
Part 2: The constant-velocity model for position vs. time
You must score a minimum of 85%. Take a screen shot of your score and submit to canvas.
You must score a minimum of 85%. Take a screen shot of your score and submit to canvas.
Part 3: A more complex model
You must score a minimum of 85%. Take a screen shot of your score and submit to canvas.
You must score a minimum of 85%. Take a screen shot of your score and submit to canvas.
Ergobot Tips:
1. You MUST forget the ergobot when disconnecting it from your ipad's bluetooth
2. Do not lock the wheels when you are matching motion
3. Your volume must be turned all the way up on your ipad
4. Connect to one ipad in your group and share that ipad for Part 1 data collection
1. You MUST forget the ergobot when disconnecting it from your ipad's bluetooth
2. Do not lock the wheels when you are matching motion
3. Your volume must be turned all the way up on your ipad
4. Connect to one ipad in your group and share that ipad for Part 1 data collection
Investigation 4A: Ticker Tape Robot Lab
Go to the very bottom of page 111 and click on the interactive simulation 'ErgoBot in “ticker tape chart” mode'
Take screen shots of the following outcomes using the simulation and ergo bot:
1. Constant slow velocity
2. Constant fast velocity
3. Speeding up
4. Slowing down
You must label each ticker tape section appropriately. You can use the 'mark up' option in the Camera app in order to label the appropriate sections. You may need more than one screen shot if necessary to show the four outcome
Sketch the stacked qualitative kinematic graphs for each outcome: position-time, velocity-time and acceleration time. You should have 3 graphs for each outcome, so a total of 12 graphs.
Compile your work in to a single file and submit your work to CANVAS.
Investigation 4A: Robot on an Incline Plane
Go to page 111 in Chapter 4. Go to Part 1 and click on the first interactive simulation. Use the inline and ergobot to collect data. Save the data locally. Close the first interactive simulation and click on the second. Open the file associated with the last data collection. Select the 'Table' view option and put time on the x-axis and velocity on the y-axis. Select the 'Graph' option and change the y axis view window to have +7 and -7 as the maximum and minimum. Set the x axis view window to go from 0 and 1.5 second as the maximum and minimum. Select the 'Model' view and attempt to fit a line of best fit to the velocity-time graph for two intervals, when it is going up the ramp and when it is going down. Take a screen shot of each best fit line. The slope of the velocity time graph is the acceleration. Go back to 'Table' view and put acceleration on the y-axis. Check to see if acceleration matches what you calculated from the slopes of the velocity-time graph. Take a screen shot of the acceleration-time graph. Last, calculate the percent error each v-t graph slope and the actual acceleration. Percent error = ((v-t slope - actual acceleration)/(actual acceleration)) *100).
Submit your percent errors and the following three screen shots to CANVAS:
1. Best fit line of the velocity-time graph with the ergobot traveling up the ramp.
2. Best fit line of the velocity-time graph with the ergobot traveling down the ramp.
3. Acceleration time graph.
Submit your percent errors and the following three screen shots to CANVAS:
1. Best fit line of the velocity-time graph with the ergobot traveling up the ramp.
2. Best fit line of the velocity-time graph with the ergobot traveling down the ramp.
3. Acceleration time graph.
Physics Taboo
*Write your group member names and the number of your scenario on the white board.
*Sketch your scenario's graph on the whiteboard.
*The more creative your story, the better.
*You SHOULD use a few words from the list in your descriptions.
*The story must be school appropriate and not single out individuals.
*The story must be written in complete sentences and you may include illustrations.
